
When it comes to customer experience metrics, many details must be taken into account. Knowing the advantages and disadvantages of each metric is essential for implementing a good customer-centric strategy, isn't it?
According to a study by Lee Resources, for every dissatisfied customer who complains, 26 remain silent. So if you think this scenario might be happening to your company, you need to keep reading this article and take the appropriate steps so that monitoring customer experience doesn't become a barrier to your business.
Fortunately, a good customer satisfaction management tool can help you collect valuable feedback, enabling you to make the improvements your customers are requesting, offering a better experience and a more pleasant customer journey.
But before that, we need to talk about the concept of customer experience. And to keep things simple, it's important to mention that customer satisfaction metricsare also called customer experience metrics, or CX metrics.
What is CX?
CX stands for Customer Experience .It refers to the overall perception your customer has of your product or service, through all interactions throughout the customer lifecycle.
But its significance is not limited to the consumer experience alone. This perception influences customer behavior, builds memories that fuel loyalty, and affects the economic value generated by the organization.
If you're still unsure about the importance of customer experience in companies, know that this strategy is already becoming the main competitive differentiator for companies in 2020, surpassing prices and product.
Furthermore, customer experience is directly linked to customer loyalty to your brandand to retention in your business.
Ultimately, data shows that consumers who have a positive experience are 5 times more likely to recommend a brand to others and 54% more likely to do business with you again.
Customer experience metrics:
When discussing customer experience metrics, NPS®, CSAT, and CES stand out as they are the most widely used indicators worldwide. With that in mind, we've compiled a list with a brief explanation of each:
NPS® (Net Promoter Score)
NPS® or Net Promoter Score is a metric designed to measure and understand customer loyalty levels . Its goal is to determine a consistent and easily interpretable score that can be compared over time or across different industries.
This metric assesses how likely respondents are to recommend a particular company, product, or service to friends, family, or colleagues.
The idea is simple: if you enjoy using a product or doing business with a particular company, you want to share that experience with other people, right?
And the Net Promoter Score question is simple. On a scale of 0 to 10, you ask customers:

Depending on their response, customers will be divided into three categories, based on their Net Promoter Score:
- Promoters (score 9-10): Loyal enthusiasts who will continue to buy and recommend your products to others, fueling the growth of your business.
- Neutral (score 7-8): Satisfied customers who buy with average frequency and are vulnerable to competitive offers.
- Detractors (score 0-6): Dissatisfied customers who can damage your brand and hinder growth through negative word of mouth.
CES (Customer Effort Score)
Customer Effort Score is a metric used to measure the level of effort a customer had to put into resolving a specific problem with your company.
The Customer Effort Score question is on a scale of 1 to 7, which asks:
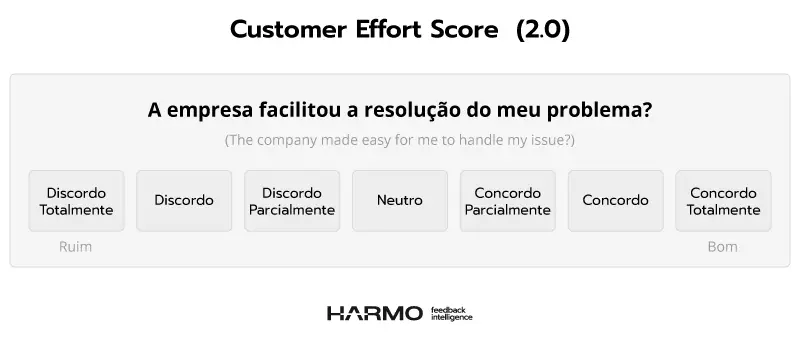
To calculate customer effort, a weighted average of the scores must be taken to determine a score out of 7. The higher the score, the less effort was put in.
Tip: A good practice is to display the data on corporate TV to monitor customer experience metrics in real time, creating a visual management model for all employees.
CSAT (Customer Satisfaction Score)
The Customer Satisfaction Score is a metric that directly measures customer satisfaction levels in specific interactions, and is measured using a numerical scale that asks:
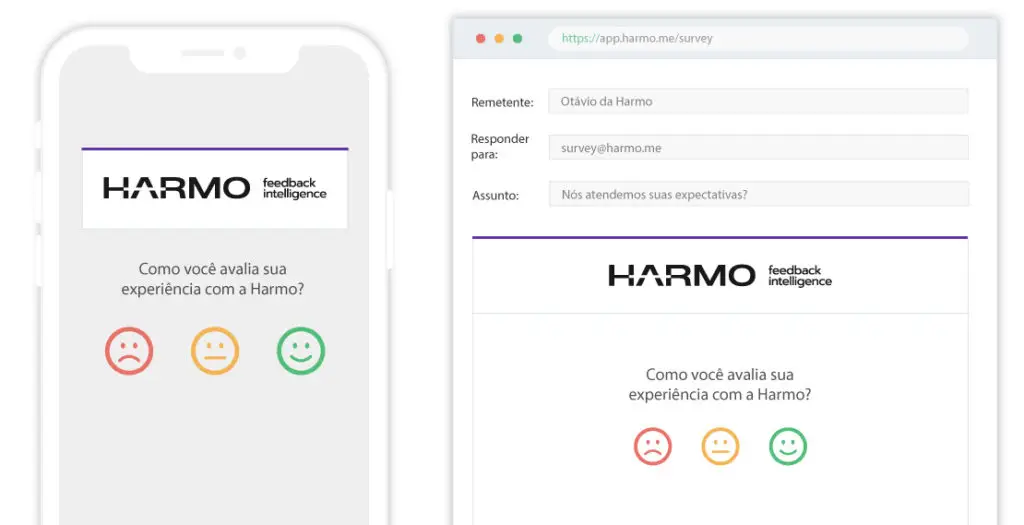
There are several ways to calculate CSAT because there are different ways to measure this score.
Therefore, customer satisfaction scores can be measured in five ways, which are:
- Yes and No – 1 and 2 (binary)
- Dissatisfied/Neutral/Satisfied – 1 and 3
- 1 to 5 (Likert scale)
- 1 to 7 (Likert Scale)
- 0 to 10 (Likert scale)
If you choose to calculate CSAT on numerical scales such as 1 to 5, 1 to 7, or 1 to 10, you will need to calculate the weighted averageby adding up all the occurrences and dividing by the number of respondents.
But if you opt for model 1 and 2, or 1 to 3, the calculation ends up being easier, since you will basically have to subtract the percentage of satisfied customers vs. dissatisfied customers.
What is the best metric for customer experience?
I confess that this question is quite frequent, but before discussing the advantages and disadvantages of each metric, it's necessary to understand that there isn't a better or worse metric – there's the right metric according to the needs you're seeking through your satisfaction survey. From there, let's talk about the strengths and weaknesses of each:
NPS – Advantages
To begin with the advantages, NPS offers good customer segmentation. This means you can see exactly what types of customers you need to focus your efforts on (promoters, neutrals, or detractors) to achieve better results.
By analyzing the data individually, you can gain insights into the long-term relationships you are building, and whether your company is on the right track to achieve its goals through the methodology.
Furthermore, NPS surveys tend to be very accurate, as they use a higher degree of bias to obtain feedback on a product or service.
Instead of asking about a specific experience, NPS uses a broad question to investigate the likelihood of customers recommending a company as a whole.
The effect is that scores and feedback are less likely to be affected by specific events. As a result, your company receives feedback , with fewer discrepancies caused by recent positive or negative customer experiences.
Another important point is that NPS is a long-term customer experience metric. That said, NPS seeks to understand the levels of referral/recommendation of your brand, and not just the individual customer experience.
The premise of the metric is based on the fact that people are unlikely to recommend a brand if they don't trust it – and if they do recommend such a brand, they are more likely to have a positive connection with it.
And the last positive point about NPS worth mentioning is that these surveys tend to have a higher response rate. While an average survey has a response rate between 3% and 5%, NPS surveys excel with response rates in the 20% to 40% range.
These results are usually obtained because there is only one question, and because the numerical scale is an easier way for respondents to provide quick feedback, since they do not need to read additional text.
And this much higher-than-average response rate means that even a small NPS research target audience can produce significant and statistically substantial data that your company can use to improve retention and generate more revenue.
NPS – Disadvantages
Now, in terms of disadvantages, NPS research requires follow-up, so you can't rely on just a single question or base your conclusions solely on the first survey.
Furthermore, it is very common for good NPS ratings to create a "tunnel vision" effect, where companies think they are on the right track and don't need to continue monitoring the customer experience.
While a high NPS score is a great achievement, you can't simply assume all the work is done.
You need to act on this score and start engaging your promoters to advocate for your brand to others, and become even more proactive in addressing the issues faced by detractors, in a cycle of continuous improvement.
Another key point is that in B2B scenarios, NPS research can contain errors. It's important to pay attention to the fact that what you call a customer is, in reality, an account.
Therefore, sending an NPS survey to B2B companies means sending surveys to different employees within a company, who most often are not the decision-makers.
Finally, it's essential to have the respondents' information to use NPS effectively. Only when you identify the customer can you close the loop – a fundamental step within the Net Promoter methodology.
CES – Advantages
One of the main reasons for using the Customer Effort Scoreis that, according to research from the Harvard Business Review, the results obtained through this metric are a strong indicator of behavior, showing a high likelihood of future purchases. The same study shows that 94% of consumers who report having interactions with a brand with "low effort" indicate that they would do business with that brand again.
Another study showsthat 81% of consumers who report having interactions with a "high level of effort" say they would speak negatively about the brand in question. And what does this mean in practice? That the CES metric can also provide information about the likelihood of your customers recommending your company to others.
The idea is that if it's very easy for them to do business with you, they'll be more likely to promote your service and do business with you again.
Finally, because the research focuses directly on customer effort, it offers actionable data that allows you to quickly identify friction points in different types of interaction with your brand, such as – high effort to exchange a product or contact the support team.
CES – Disadvantages
Now, regarding the disadvantages of the CES metric, it doesn't allow for customer segmentation. Because it's a transactional metric, used immediately after a specific event, you can't discover what type of customer had problems interacting with your product.
In this way, you only discover the problem, and most of the time you don't have the information to identify that user/customer.
For example, a customer using the starter plan might find it difficult to perform an action with your product because the functionality they would like to use is in the PRO plan, but they haven't subscribed to the PRO plan nor received training for that functionality.
In this case, the metric results show that this customer had problems interacting with your business, when in fact, this type of issue could have been resolved through a chat with the customer service team
And lastly, you can't prove whether factors like pricing or competitors are influencing customer responses, which in a way limits the use of the metric to only certain points in the customer journey.
CSAT – Advantages
The Customer Satisfaction Score's lies in its flexibility and ease of application. You can easily customize the questions to conduct a detailed analysis of your brand's strengths and weaknesses.
And since the rating scale can be customized, this allows you to use different indicators (such as numerical scales, stars, emojis, yes/no) that appeal to your audience.
Furthermore, the CSAT allows you to use different formats, applicability, and sending frequency. Its ease of understanding yields good response rates, and it is also very powerful when combined with other customer experience metrics, such as NPS and CES.
CSAT – Disadvantages
Now, speaking about the limitations of the metric, the first point is that CSAT only reflects the customer's sentiment in the short term, since the results are usually based on how customers are feeling at a given moment/interaction.
There is also the problem of subjectivity, since "satisfied" can mean different things in different contexts.
The issue of cultural bias should also be considered, because according to an article in Psychological Science, people from more "individualistic" countries are likely to choose the more "extreme" sides ("Very satisfied," "Very dissatisfied"), while people living in more collectivist countries will use a less extreme score, unless the experience is very unpleasant.
Another factor to consider is that the CSAT score can be very difficult to accurately quantify customer satisfaction or dissatisfaction levels , since the metric often ends up being generic and, depending on the case, prone to errors in its application.
For example, users who rely on your brand's customer service daily may not feel comfortable giving honest feedback to the brand, especially if they think it could affect their relationship with the company.
Finally, CSAT scores are not linked to customer loyalty. As mentioned in previous points, customer satisfaction relates to a specific interaction and does not take into account future purchase behavior or predictions.
For example, having a high score doesn't mean you can predict repeat purchases or customer referrals. In theory, a high score means they are enjoying your service and are likely to promote your brand.
But to find that out, you need to apply the NPS and cross-reference that information with the CSAT, so you can identify the link between customer satisfaction and loyalty .
Conclusion
Although customer experience metrics have their specific uses, each one has strengths and weaknesses, and they also have different ways and contexts to be applied.
Since the standard NPS question isn't related to a specific experience, it's a great starting point if you're not already conducting research, as it gives your customers more freedom to talk about your product or service.
The end result is actionable and meaningful feedback that your company can use to make real changes, focusing on what customers are saying to increase retention and recurring monthly revenue.
Furthermore, NPS has a strong focus on long-term growth, as there is no element as correlated with sustainable long-term business growth as customer loyalty.
Since NPS asks customers how likely they are to recommend your product/service to others, it offers accurate insight not only into how customers perceive your brand, but also into the likelihood of helping it grow organically.
Interested in measuring customer experience metrics? Learn about Harmo Feedback Intelligence, a platform designed for people who want to learn daily from their customers.