
Did you know that NPS has an update? NPS 3.0 is the new version of the Net Promoter Score methodology, famous for measuring the level of customer satisfaction and loyalty to products, services, and brands.
Widely used by service and success teams, this metric now also encompasses financial gains, making the profits and financial returns behind customer loyalty and satisfaction more tangible.
To update you on this change, we'll talk more about NPS 3.0, how to calculate it, and how to implement it in your business. Stay tuned!
What is NPS 3.0? Understand the evolution of the metric
The NPS (Net Promoter Score) was introduced by Fred Reichheld in 2003 in his article published in the Harvard Business Review.
The metric, which focuses on customer satisfaction, consists of asking customers a single, simple, and quick question: "On a scale of 0 to 10, how likely are you to recommend our company/product/service to a friend or colleague?"

Based on the response, customers are categorized into three groups:
- Promoters (scores 9-10): those who promote your company, speak well of the product, and give spontaneous referrals.
- Neutral (scores 7-8): has nothing to complain about, but will hardly make the effort to recommend you to anyone, either negatively or positively.
- Detractors (scores 0-6): have had negative experiences and tend to speak badly of the company to others. They can be detrimental to the business's reputation.
Based on the ratings, the calculation is done by subtracting the percentage of detractors from the percentage of promoters to understand the level of customer satisfaction with a business.
From this simple metric, several evolutions have emerged to introduce deeper insights into the rating. With this, in addition to simply seeking quantitative data, many companies have begun to introduce open-ended questions to seek qualitative feedback, so that they can truly understand a little better why the rating was given.
Then came NPS 3.0, which maintains its principle of understanding customer satisfaction and loyalty , but also begins to look at how this translates into real financial results for the business. In other words, it aims to measure company growth based on customer satisfaction .
This update is very important because it now takes into account the customer experience, which is the main focus of the relationship between companies and consumers today.
For this purpose, the EGR, Earned Growth Rate, is added to the metric. With the new metric, it is possible to see more quickly the profits – or lack thereof – behind loyal customers, gathering data to consider costs and project whether they will become profitable in the long term.
What is the difference between NPS 3.0 and previous versions?
Like many methodologies, NPS has been refined due to market needs and business evolution. In short, the main differences between its versions and those in the author's books are:
- NPS 1.0 – The Ultimate Question: This initial section of the methodology aims to explain and introduce the NPS system and its statistics: how to understand, improve, and apply it to your business.
- NPS 2.0 – The Ultimate Question 2.0: focuses on NPS system management, introducing more quantitative analysis and already focusing on financial results and competitive advantages.
- NPS 3.0 – Winning on Purpose: presents the best practices of NPS, enhancing the use of the methodology in companies and, definitively, focusing on the relationship between experience and revenue.
Earned Growth Rate (EGR): The relationship between customer satisfaction and revenue growth
As we mentioned, NPS 3.0 is based on the Earned Growth Rate (EGR), which measures revenue growth generated by repeat customers and their referrals, and also allows for a better understanding of where profit is coming from in relation to customer satisfaction.
Therefore, before understanding how to calculate NPS 3.0, it's necessary to understand EGR. To calculate the Earned Growth Rate, you need to understand its two components, which are:
- NRR (Net Revenue Retention): This measures the revenue generated from active customers who have already purchased from the company in a specific period.
- ENC (Earned New Customers): measures the value of revenue growth from new customers through referrals.
NPS 3.0 Calculation: Understand how to measure the evolution of the Net Promoter Score
Now that you know what EGR is, let's calculate NPS 3.0: To calculate EGR, you need to add the NRR and the ENC and then subtract 100 from the result. By doing this, you get the growth rate gained.
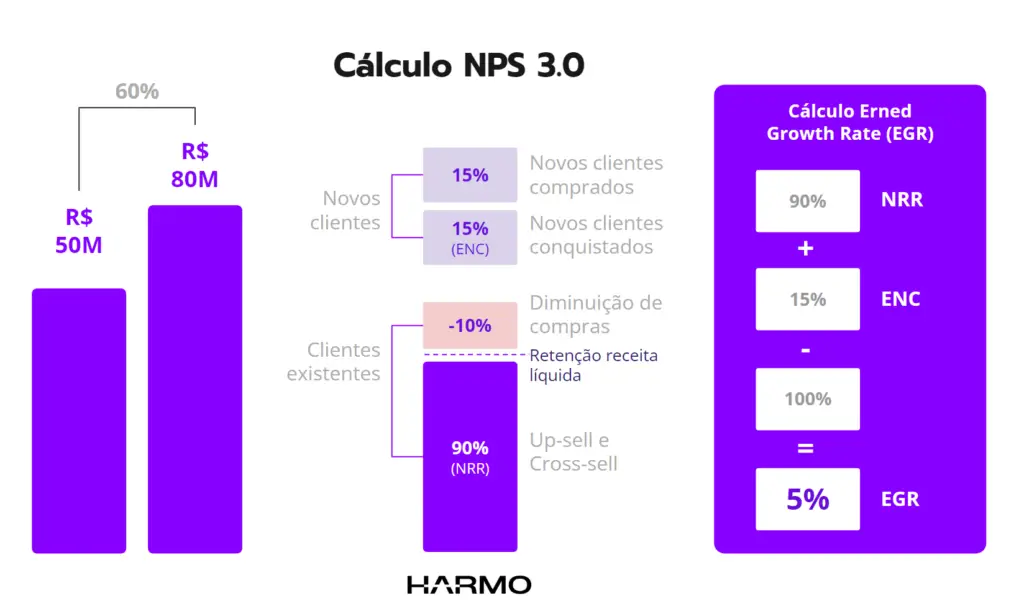
Let's think practically: a company's revenue increased from R$50 million in 2023 to R$80 million in 2024. Of this growth, 90% came from existing customers (NRR), while 15% came from new customers (ENC). Therefore:
EGR = 90 (NRR) + 15 (ENC) – 100 = 5%
As a result, the business achieved a growth rate of 5%.
Practical steps for implementing NPS 3.0
NPS 3.0 goes beyond simply seeking customer feedback; it requires having data and internal databases to ensure accurate calculations. Therefore, it's essential to invest in how your business has collected data over time and, more importantly, in how customer traffic is actually recorded.
1. Invest in data
For the calculation to yield accurate results, it's necessary to know exactly how much your existing clients generate and, more importantly, how much revenue clients acquired through referrals.
Herein lies the biggest challenge, as many companies fail to measure the return on investment from those who refer others. Therefore, to achieve effectiveness with your NPS 3.0, you need to invest in ways to segment and build a database.
Knowing how your customer arrived at your business is essential not only for this metric, but also for understanding what works and what doesn't, for investing in channels, and for creating end-to-end business strategies.
2. Understand the metrics used for your business
There are many metrics for customer service, success , and experience, and it's important to keep in mind that not all of them will be relevant to your business. Simply gathering all existing metrics and calculating them in a spreadsheet isn't enough; they should guide you in understanding what's successful and what isn't, and help you chart paths for innovation and business improvement.
It's not enough to implement various metrics that get lost and don't actually make a difference to the business results. Therefore, before using NPS 3.0, look inward: has NPS already been implemented? Were the results of promoters and detractors already being seen in your business?
There's no point in trying to innovate with an update if the "original" NPS isn't properly implemented in the business, does that make sense?
3. Experience first
Customer loyalty stems from positive experiences with the business; therefore, it's necessary to invest in experience, personalization, and attention to every point in their journey before implementing NPS 3.0.
Only with good experience strategies does it make sense to look at your customers and referrals financially, using a metric.
Conclusion
How important is customer experience to your business, and how well have customer loyalty and satisfaction been measured? It's important to stay updated on market metrics and innovations, but it's also necessary to understand what makes sense for your specific situation so that metrics truly guide changes and practical actions for business success.
Is NPS 3.0 starting to make sense for your business? Now that you know more about it, consider whether your company is mapping customers who come from referrals and invest more and more in customer experience and putting your customer at the center!