
The behavior of Brazilian consumers in the out-of-home food sector is changing, and understanding this dynamic is essential for the competitiveness of bars and restaurants.
The report "State of Reputation 2023: Overview of Reviews in the Bars and Restaurants Sector," a result of a partnership between Harmo and Abrasel, presents an unprecedented survey of 279,317 reviews on Google Business Profiles, published between January 2023 and September 2024.
This study not only maps customer perceptions, but also contextualizes how these opinions shape purchasing decisions and business strategies in the segment.
We hope that managers, entrepreneurs, professionals, and organizations in the sector can use this material to transform their businesses, promoting increasingly appropriate and personalized experiences for their clients and partners.
Throughout this material, we will explore the key data from the report, offering an unprecedented benchmark for the sector, designed primarily for leaders and managers seeking to transform online reputation into a strategic asset.

Demographic data
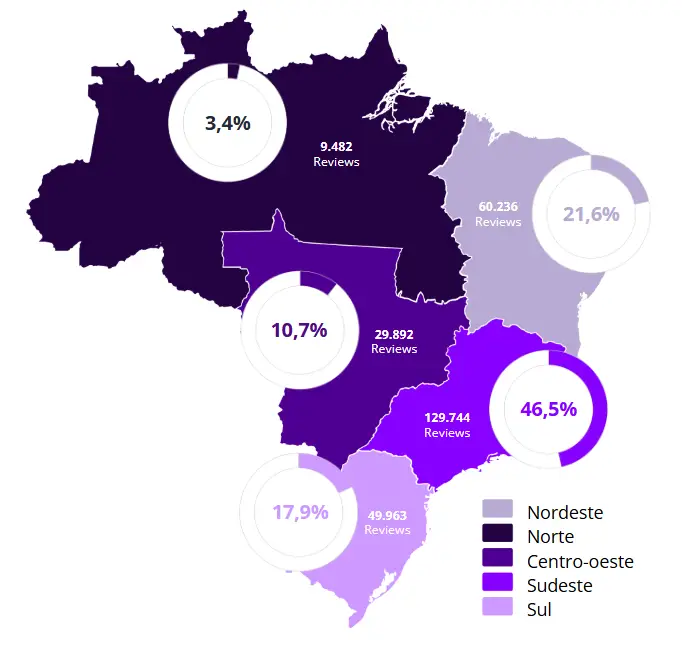
The networks selected for the study have a greater presence in the Southeast (46.5%), Northeast (21.6%), and South (17.9%) regions, which is reflected in the high volume of reviews in these areas, representing more than 85% of the total.
The ratio of reviews written by men to those written by women is divided as follows: 55% were written by men and 45% by women.
Gender classification is performed using artificial intelligence, which identifies users based on their Google names.
Locations analyzed
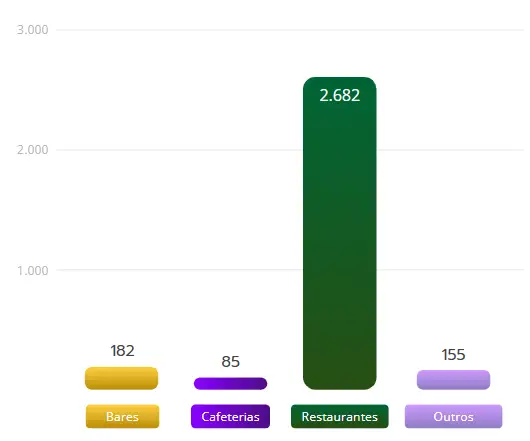
The sample of locations analyzed, comprised of ABRASEL members, reveals a clear predominance of the Restaurants category , with 2,682 establishments evaluated, representing the largest portion of the study. Next are Bars with 182 locations, the Other category with 155, and finally, Cafeterias , with 85 evaluations.
This difference in the volume of reviews highlights the representativeness of the Restaurants category, which accounts for the majority of the data analyzed.
Nevertheless, the 12.4% sample of ABRASEL members offers a reliable view of the sector, allowing for valuable analyses, even when focusing on a specific segment of brands.
Average reviews per location
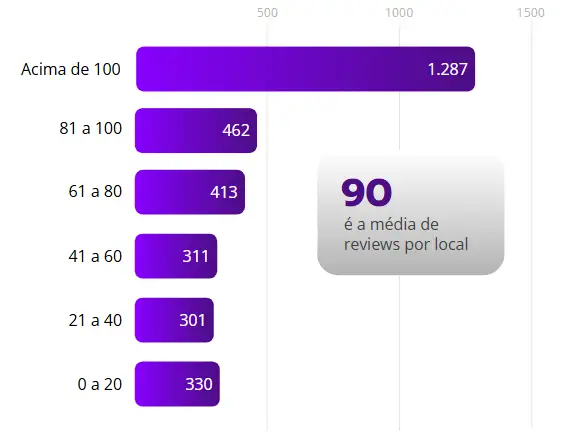
The average number of reviews received per location during the 23/24 period was 90.Of the 3,104 locations analyzed, around 40% received more than 100 reviews per store, and 60% received fewer than that – which is considered low, given the high volume of consumers who pass through the stores daily.
It's important to mention that reviews function as social proof; the more reviews a company receives, the more trustworthy it is in the eyes of consumers. In this respect, we can say that the places analyzed, for the most part, fall short of the ideal.
Therefore, there is a clear opportunity for brands to increase the number of reviews and, consequently, improve their online reputation and customer engagement.
Average reviews by category
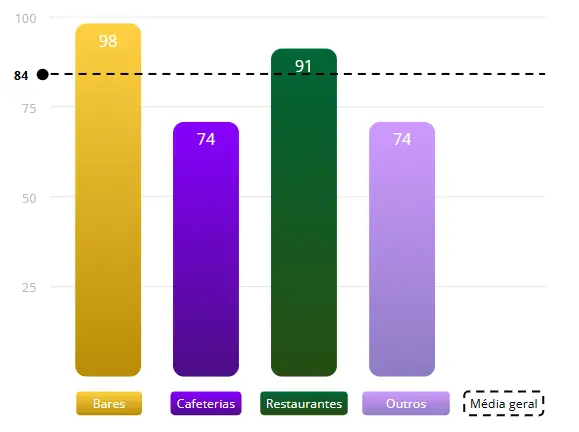
Among the categories analyzed, the coffee shop and other category has the lowest average number of reviews per location, with only 74 reviews. On the other hand, the bar category stands out with the highest average, reaching 98 reviews per location.
Here's the first big opportunity for the sector. Increasing the volume of reviews on Google is essential for a brand's reputation, as it improves visibility and builds trust with consumers.
According to a study, 90% of consumers read online reviews before visiting a physical store, and 76% say they read these reviews regularly or always before making a purchase decision. This reinforces the significant impact of reviews on the decision to visit a physical location or not.
Overall response rate
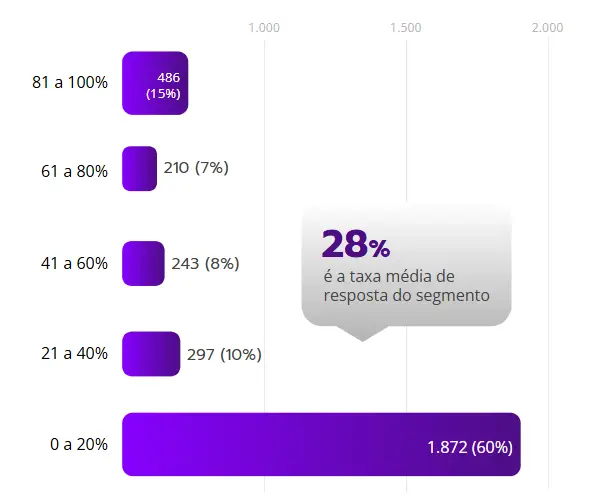
The low average response rate to reviews in the bar and restaurant sector, currently at 28%, highlights the sector's second major opportunity. The vast majority of brands have not reached the ideal response rate, which is above 80%, demonstrating the importance of adopting this practice.
Responding to customers is a simple action, but with a great impact, as it shows that the establishment values the opinion of consumers, generating a positive effect on the perception of other potential customers who search for information about the company on Google.
Studies show that interaction with reviews, especially negative ones, can reverse perceptions and directly influence purchasing decisions. This is an aspect that deserves special attention from the sector, since, according to 2024 data from the Local Consumer Review Survey, 88% of consumers say they prefer to do business with companies that respond to all reviews.
Overall sentiment rate
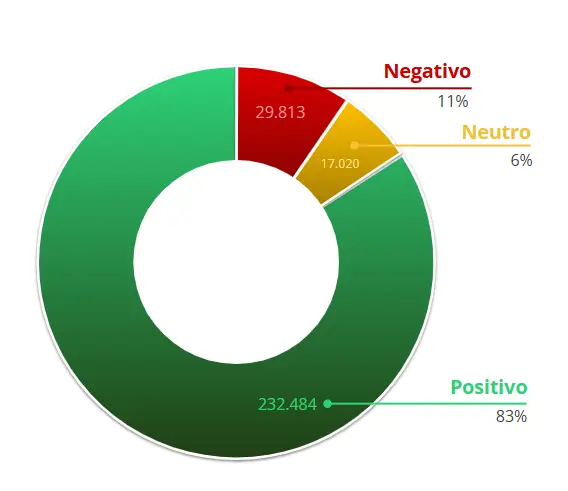
The graph represents the sentiment rate of reviews according to the stars given by consumers. We categorize 1 and 2-star reviews as negative, 3 stars as neutral, and 4 and 5 stars as positive. This categorization is the global standard for this popular metric that reflects public customer opinion.
The sentiment index based on reviews collected in the study shows that 83% of reviews are positive, 6% are neutral, and 11% are negative. The proportion of negative reviews in the sector is above the ideal, which is 5%.
Focusing on reducing the rate of negative reviews increases positive customer perception and impacts the organic ranking of businesses in local searches. And there's only one way to decrease this negative rate: provide excellent customer service and earn more positive reviews.
These actions will not only increase the volume of reviews, but will also have a direct impact on organic ranking in local searches.
Sentiment rate by category
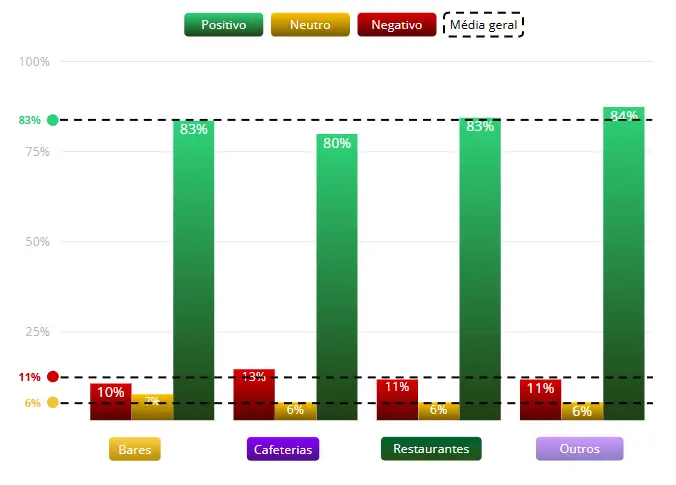
When analyzing the sentiment rate by category, a slight variation is observed in positive reviews , ranging between 80% and 84%. However, in the case of negative reviews, coffee shops stand out negatively, with 13% unfavorable ratings, while the other categories maintain an average rate of 11%. It is important to highlight that the bar category performed below average in all three sentiment indicators, while restaurants and other categories exceeded the same indicators.
Textual analysis
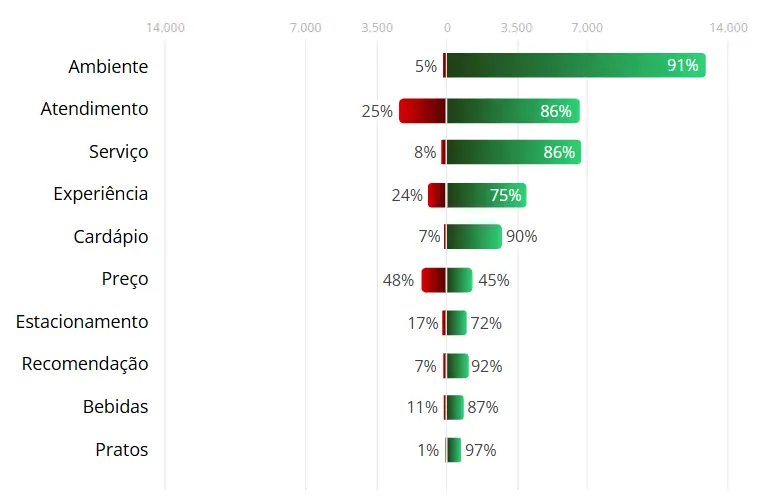
The results of this analysis were generated by artificial intelligence, which categorizes the text and assigns sentiment to the customers' verbalization.
Of the more than 279,317 public reviews analyzed in 2023 and 2024, 48.7% contained a comment describing the experience with the establishment.
The chart to the side shows the topics most discussed by consumers and consumer sentiment regarding them. A general summary of the topics is provided on the next page.
Negative summary
According to the negative reviews analyzed, the main problems faced by the brands analyzed include:
- The service is frequently criticized for being slow, disorganized, and sometimes rude;
- Inconsistent food quality, with reports of poorly prepared and tasteless dishes;
- The prices are considered high in relation to the quality offered, generating dissatisfaction regarding the cost versus benefit;
- Environments with excessive noise;
- Lack of options for specific diets;
- Many customers express disappointment and reluctance to return to the establishments.
Positive summary
Overall, these establishments provide satisfying dining experiences, combining good food, quality service, and pleasant environments, catering to different tastes and occasions.
Key features include:
- The food is high quality, with a variety of tasty dishes to suit different culinary preferences.
- The service is frequently praised as attentive and efficient.
- The environments are described as welcoming and pleasant, suitable for various occasions.
- Facilities such as parking.
- Some establishments stand out for unique features, such as panoramic views, options for specific diets, and live music.
Overall segment rating
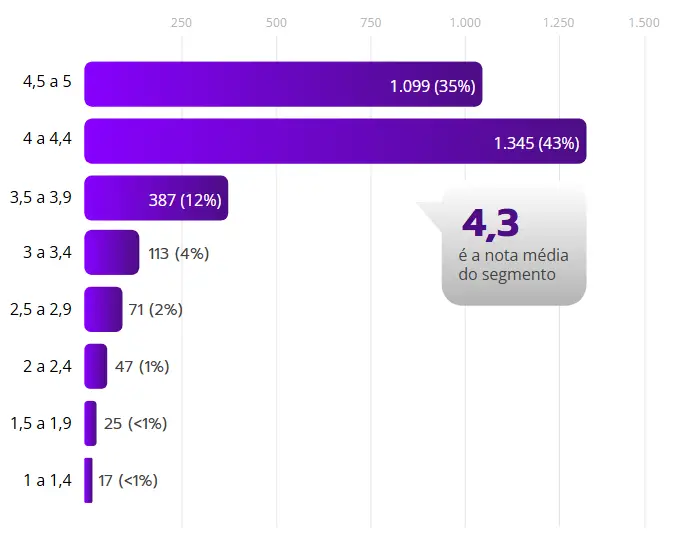
During that period, the average rating for the brands analyzed in the sector was 4.3 stars on Google, close to excellence, which starts above 4.5.
Analysis of the ratings reveals that 1,559 locations (50%) exceeded the segment average, achieving scores higher than 4.3, while the remaining 50% were at or below average. According to the study, 92% of consumers consider buying only from companies with ratings of 4 stars or more, and in the current survey, 50% of the brands reached this minimum score.
However, it is important to highlight that 160 locations fell below a 3-star rating. Recent data shows that customer confidence drops drastically by 67% when the rating falls from 4 to 3 stars.
Segment rating by category and region
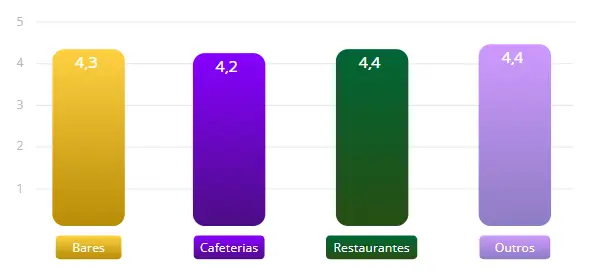
Although the variation in scores between categories is small, it is worth highlighting that bars and cafes have an average of 4.2 and 4.2, while restaurants and others reach 4.4. This slight difference suggests a relatively uniform perception of quality across categories, with a minimal margin of variation.
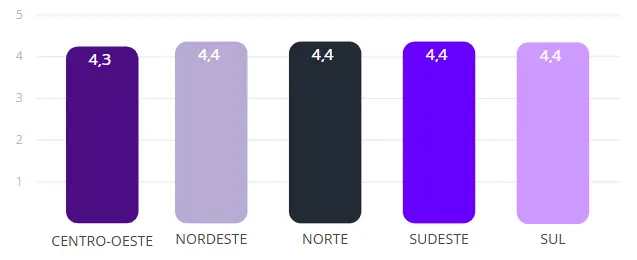
This consistent behavior is also reflected in the regional analysis, as illustrated in the graph to the side, which may indicate that consumer expectations regarding experience and service are similar, regardless of location or type of establishment. This uniformity highlights the importance of maintaining a high standard across all fronts, since small improvements can be decisive in outperforming the competition and achieving excellence in any segment.
Conclusion
The study revealed strategic data for understanding the performance of bars and restaurants associated with Abrasel in the digital environment, especially on Google. The restaurant category, the most representative in the study, stood out in indicators such as average rating, volume of reviews, and response rate. This data shows that restaurants are increasingly aware of the importance of managing their online reputation, understanding the direct impact of responding to reviews to attract and retain customers.
From a broader perspective, the bar and restaurant market is experiencing constant growth . According to Abrasel , the sector's revenue is expected to reach R$ 428 billion by the end of 2024 , a 3.3% increase compared to the previous year. This growth reflects the recovery in household consumption, which increased by 1.5% in the first quarter of 2024, exceeding the overall GDP growth. Furthermore, a study by Abrasel in partnership with Stone revealed a 5.2% increase in foot traffic at bars and restaurants in March, compared to the previous month, highlighting the sector's dynamism.
This scenario highlights the importance of actively managing online reputation as a competitive advantage. Companies that regularly respond to reviews attract more customers, consolidate a positive digital presence, and directly influence purchasing decisions. According to a study, 4 out of 5 consumers change their minds after reading a negative online review, emphasizing the impact of reviews on the purchase journey and decision-making process.
Furthermore, research shows that 50% of consumers who research online visit a physical store within 24 hours, and the average purchase value in physical stores is 20% higher than in online stores, according to Forrester. This data reinforces the importance of maintaining optimized digital profiles and responding to reviews to maximize customer conversion potential.
This information shows that the sector is evolving towards a more digital and customer experience-centric model. Companies that recognize Google as a strategic channel for attracting customers will have a significant advantage, given that 82% of consumers research online before visiting a physical store.